Create Custom TeamDynamix Dashboards
You can create custom dashboards in TeamDynamix (TDX) to suit your group or individual workflow. You can reorder or remove dashboard reports to create your desired layout and can add any report to which you have access.
This article applies to: TeamDynamix
The following instructions assume that you have already logged in to TeamDynamix, and are on the tab (look for the house icon).
Create a Dashboard
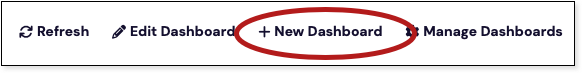
In the menu bar at the top right of the window click
- Give your dashboard a Name and add an optional Description.
- Click .
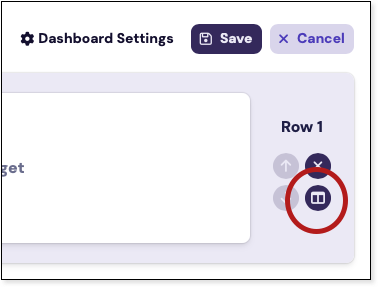
On the Content tab that opens, you will have a default of one row with space for two widgets. At the far right of the default row you can click the two-column icon to choose additional layouts to add more than one column to this row.
- To add content click . A new window will appear and you can then navigate or search for the report. When you find the report select it and it will be added to your dashboard.
- The CIT-Technician dashboard uses these reports by default.
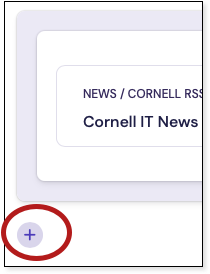
To add a new row, click the sign below the first row.
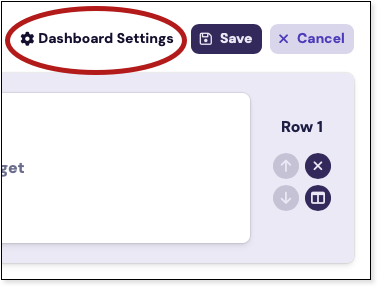
When you finish adding content to your dashboard, click on at the top right of the screen.
You can choose to keep the dashboard for or .
Please do not select Everyone, this shares the dashboard with all TDX users in every application.You can also allow your dashboard to , and possibly .
We do not recommend setting the Visibility to Public. If you use this option please select .- Click and your new dashboard is ready to use.
Edit a Dashboard
- Make sure you're looking at the dashboard you want to edit.
In the menu bar at the top right of the window click
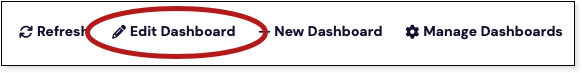
- You can add and remove rows and columns, change, and rearrange visible widgets.
Change the visibility under .
- Click when you are satisfied.
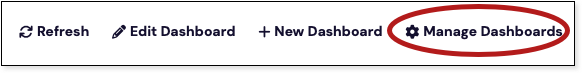
Set A Default Dashboard
You can easily set a default dashboard by clicking at the top right of your TDX window.
Click in the DEFAULT column to set your default dashboard. The word Set will change to Default. You do not need to save; you can close this window.
Remove a Dashboard
You can easily remove a dashboard by clicking at the top right of your TDX window.
Click in the DELETE column to delete the chosen dashboard. Click when the confirmation window opens to complete this request. You do not need to save; you can close this window.
Reference Video
Creating a Report (Video on Demand)
Comments?
To share feedback about this page or request support, log in with your NetID