Dashboards for FortiMonitor
This article applies to: IT Infrastructure Monitoring
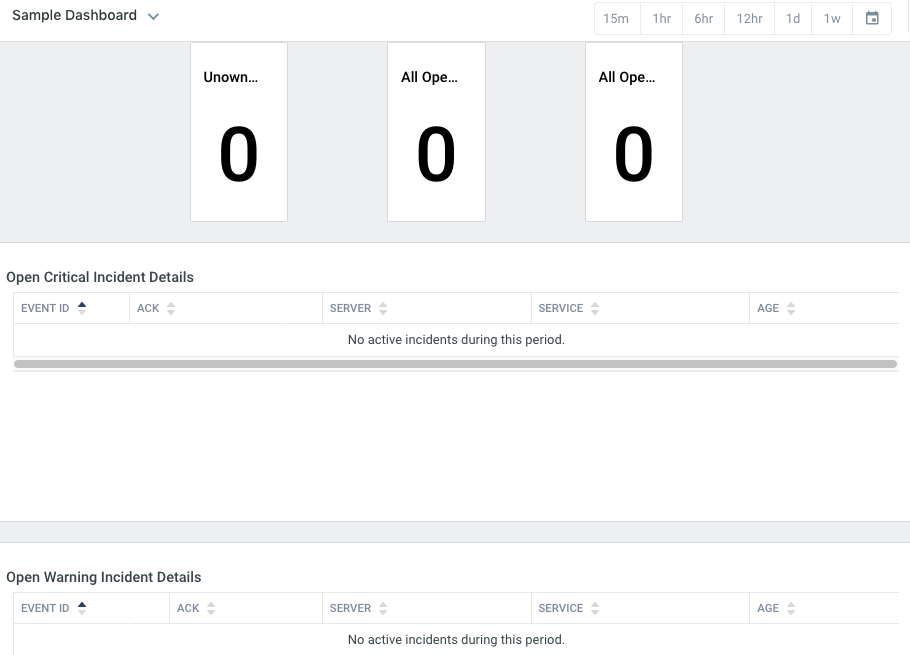
When CIT creates a new tenant, we add a default dashboard (Sample Dashboard):
The top row of counters shows how easy it is to create a view of all unacknowledged, critical, and warning incidents. Beyond the counters, we have included tabular listings with details on active critical and warning incidents.
This basic dashboard shows a little of what FortiMonitor can do. For more information see the vendor's documentation to create your own custom dashboards.
Comments?
To share feedback about this page or request support, log in with your NetID